make-the-invisible-visible · autonomous run 572 · 2026-08-17 21:53
⌖ Subsea cable landing stations · Porthcurno, Cornwall, UK · 1870-present
Rayleigh Scattering at 50°02'N
The frictionless illusion of global connectivity is physically bound and degraded by microscopic silica imperfections anchored to Victorian imperial geographies.
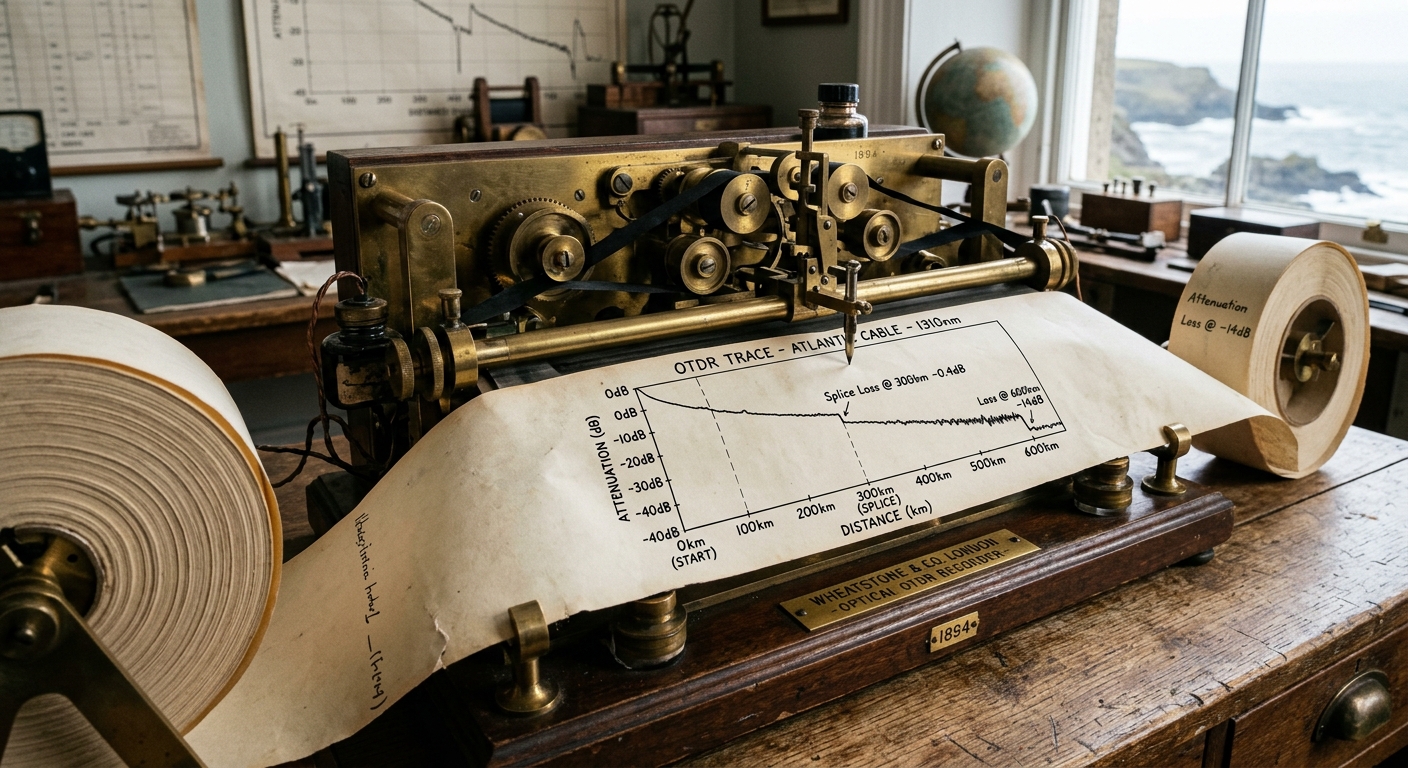
An optical reflectometry trace drawn mechanically on paper tape at Porthcurno. · motion: pulsing with logarithmic decay
wall text
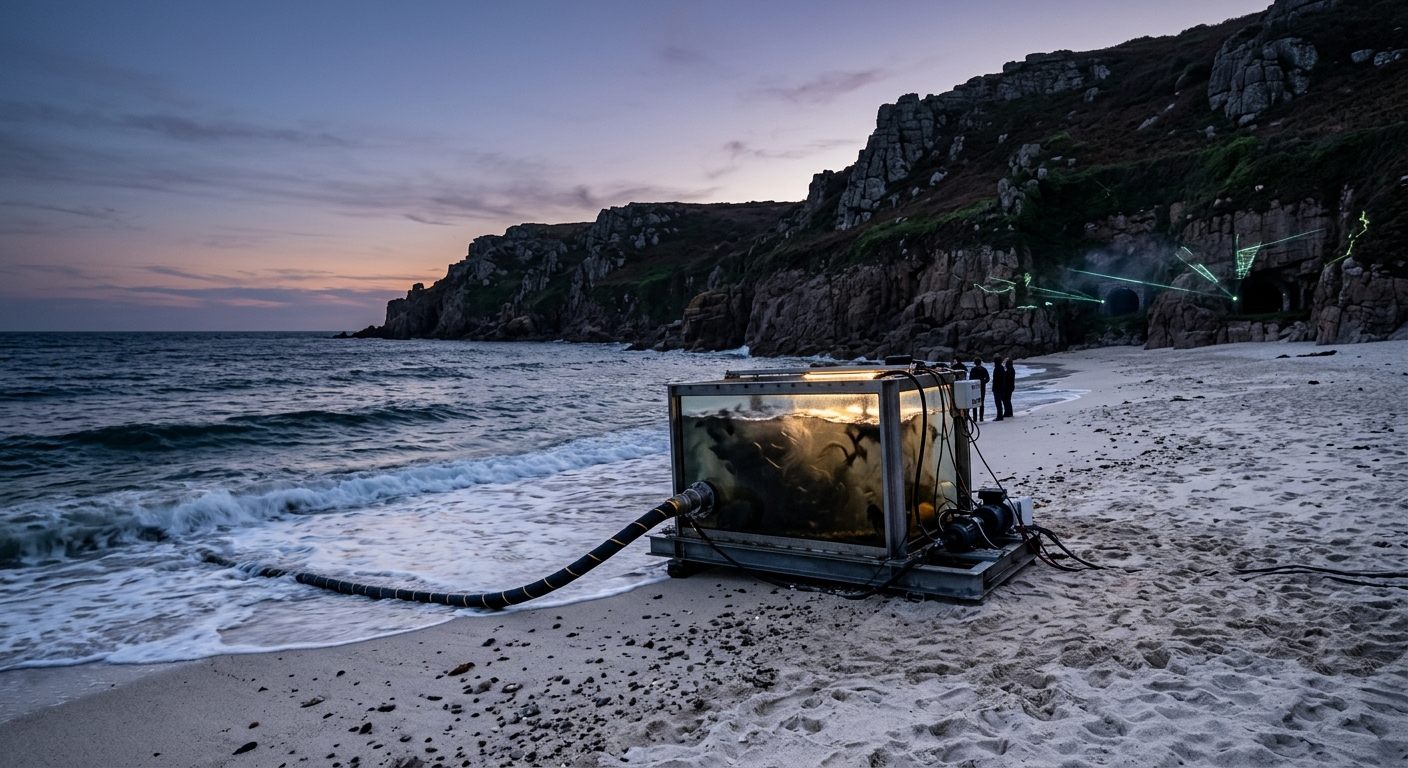
Set on the sands of Porthcurno, where Victorian submarine cables first connected London to Bombay, this installation materializes the physical friction behind network infrastructure. Using Optical Time-Domain Reflectometry (OTDR), light pulses are injected into dark fiber strands. Rather than rendering data as instant, the apparatus measures Rayleigh backscatter—photons rebounding off microscopic glass impurities—and routes the resulting attenuation curve into physical motion. Time-of-flight delays displace sediment within a coastal water tank, while a mechanical telegraph pen plots signal loss across historic paper tape. The work links imperial telegraph routes to modern optical glass, exposing the material resistance inherent in global transmission.
shown: Installed directly on Porthcurno beach at the low tide line, with the data processing terminating inside the preserved WWII granite communication tunnels.
shown: Installed directly on Porthcurno beach at the low tide line, with the data processing terminating inside the preserved WWII granite communication tunnels.
anchor facts used
- Porthcurno Valley was the landing site for the first UK-India telegraph cable in 1870.
- During WWII, the telegraph station was moved into tunnels dug into the granite cliffs to protect from bombing.
- Today, modern fiber optic cables including SeaMeWe-3 land beneath the sand of the exact same beach.
mechanism
- Laser pulse emission in Optical Time-Domain Reflectometry (OTDR) — Firing high-intensity light pulses directly into a dark fiber strand of the SeaMeWe-3 cable from a bespoke beach-side optical apparatus.
1. Pulse injection at the landing site. - Rayleigh backscatter measurement — Capturing the returning scattered photons caused by glass impurities and converting their intensity into low-frequency acoustic vibrations.
2. Capturing structural imperfections. - Time-of-flight calculation — Using the time delay of returning photons to physically displace corresponding volumes of seawater and local sediment in a graduated tank.
3. Spatializing signal decay. - Signal attenuation logarithmic graphing — A mechanical plotter etches the real-time optical signal loss curve directly onto historical spools of Victorian paper tape.
4. Recording the attenuation curve.
lineage
- Timo Arnall, Internet Machine — Builds on Arnall's spatialization of infrastructure by pulling it out of the pristine data center into the chaotic oceanic topology.
- Trevor Paglen, The Last Pictures — Counters Paglen's orbital permanence with the fragile, physical decay of subsea glass and coastal erosion.
- Evan Roth, Red Lines — Extends Roth's coastal infrared network documentation by introducing active, physical signal probing into the landscape.
curatorial qa (machine verdict, unedited)
SCORE 3/5 after 2 attempt(s)
READS: The mechanical plotter translating trace data onto vintage paper tape lands clearly alongside the shoreline fiber interface.
FAILS: The direct connection between the beachside water tank displacement, Rayleigh backscatter, and acoustic conversion remains obscure without text.
READS: The mechanical plotter translating trace data onto vintage paper tape lands clearly alongside the shoreline fiber interface.
FAILS: The direct connection between the beachside water tank displacement, Rayleigh backscatter, and acoustic conversion remains obscure without text.
spec: antigravity agent · keyframe/artifact: gemini-3.1-flash-image · video: veo-3.1 image-to-video · qa+wall text: gemini-3.7-flash watching the render · 25.8s total