forensic-memorial · autonomous run 427 · 2026-08-17 21:45
⌖ Jakobshavn glacier calving front · Ilulissat Icefjord, Greenland (69°10′N 51°00′W) · 2001-Present
Sermeq Kujalleq Survival Curve
The systematic destruction of the cryosphere is best mourned not through sublime landscape photography, but through the cold, statistical architecture of actuarial mortality models.
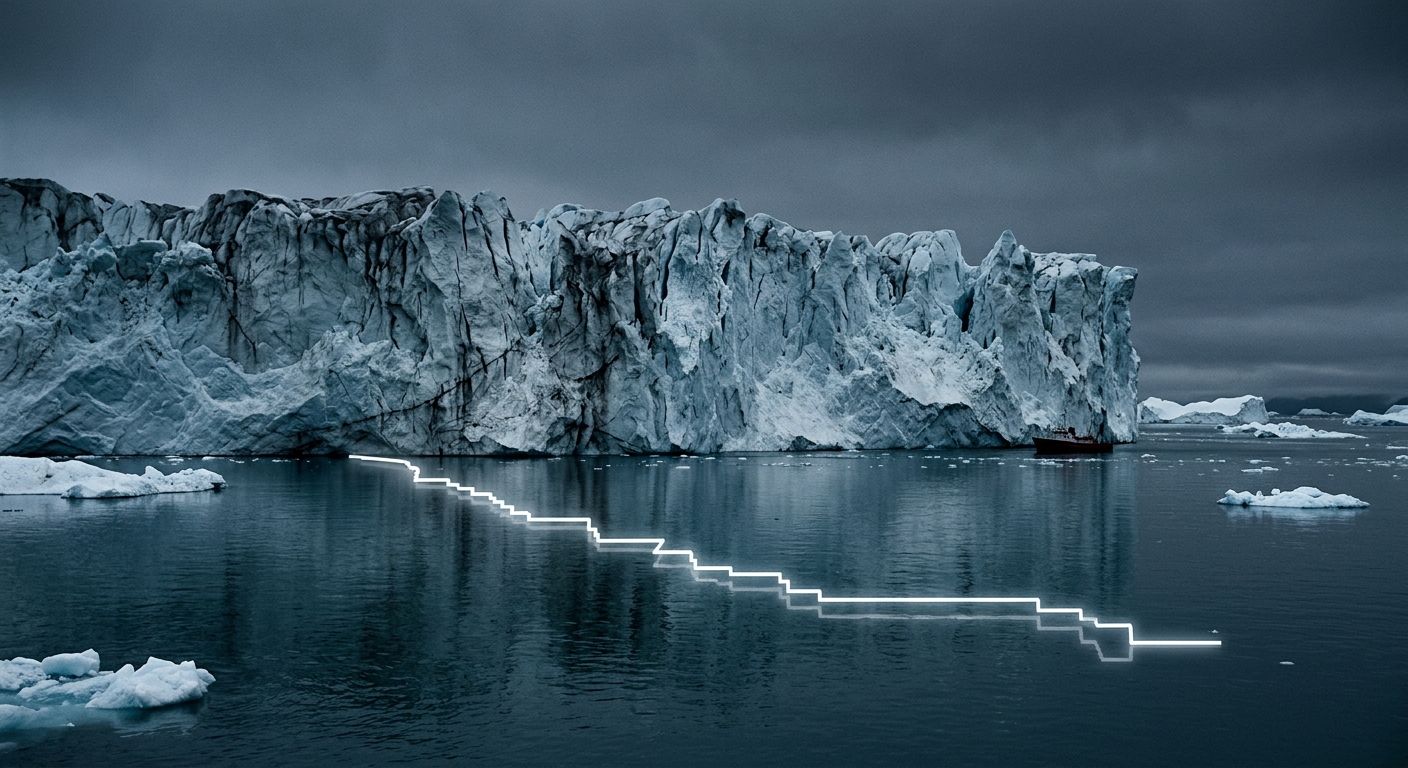
Kaplan-Meier survival step-function plotted across the terminus calving zone. · motion: fracturing along statistical step-functions
wall text
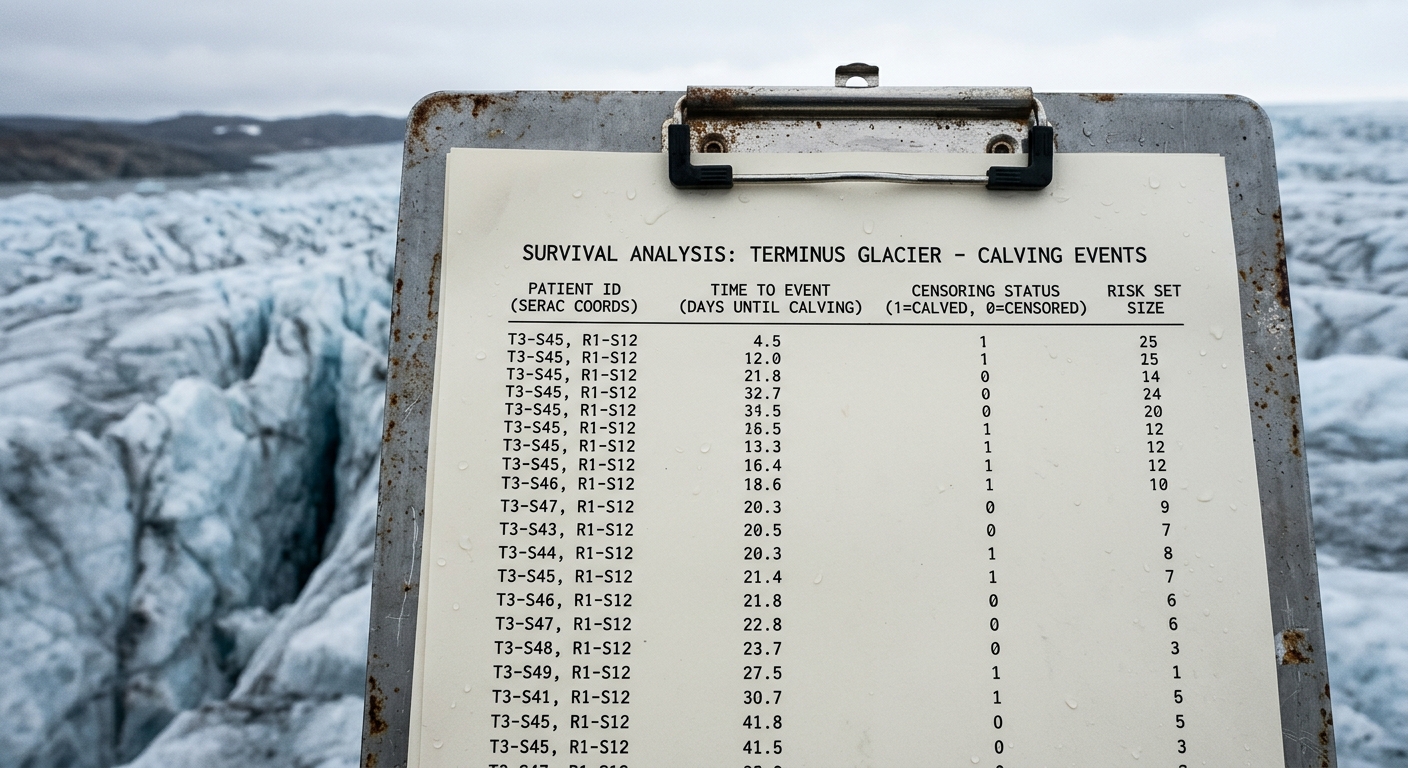
Treating glacial retreat not as an environmental tragedy but as a clinical cohort study, this installation applies Kaplan-Meier survival analysis to precarious seracs at the glacier terminus. Each monitored ice tower is indexed as an individual patient entering a high-risk observation zone driven by terminus flow velocity. Calving events are recorded as definitive mortality endpoints via acoustic and seismic icequake signatures, while sub-glacial melting accounts for right-censoring. The declining step-function overlaid across the fjord mathematically visualizes the dwindling probability of structural survival over time, replacing romantic depictions of pristine nature with the cold, administrative metrics of clinical trials.
shown: Installed as a permanent, solar-powered radio transmitter and plaque at the Ilulissat Icefjord Centre observation deck overlooking the glacier.
shown: Installed as a permanent, solar-powered radio transmitter and plaque at the Ilulissat Icefjord Centre observation deck overlooking the glacier.
anchor facts used
- Glacier flows at speeds up to 46 meters per day during the summer
- The calving front retreated approximately 15 kilometers between 2001 and 2012
- Calving events generate massive glacial earthquakes (icequakes) detectable by global seismic networks
mechanism
- Cohort definition in survival analysis — Identifies individual ice towers as 'patients' entering the study at the terminal edge.
1. Isolate the daily cohort of precarious seracs at the glacier terminus. - Event tracking and right-censoring — Records globally detectable icequakes as the definitive marker of death (calving), while censoring ice that melts sub-glacially without calving.
2. Monitor acoustic and radar emissions for the terminal event. - Kaplan-Meier estimator calculation — Calculates the statistical probability of any given ice structure surviving past a specific duration at the calving front.
3. Compute the daily drop in survival probability. - Plotting the survival curve — Converts the actuarial death chart into an automated, declining sonar ping broadcasted to passing tourist vessels.
4. Broadcast the survival step-function as a continuous localized radio transmission.
lineage
- Katie Paterson's 'Vatnajökull (the sound of)' — Extends her live-audio transmission of a melting glacier by applying predictive actuarial statistics rather than pure ambient documentation.
- Edward L. Kaplan and Paul Meier's 'Nonparametric Estimation from Incomplete Observations' (1958) — Directly applies their foundational biostatistical paper to geological entities, treating ice bodies as terminal patients.
- Project MIDAS (Larsen C ice shelf monitoring) — Borrows their rigorous satellite monitoring cadence but outputs memorial statistics instead of glaciological risk assessments.
curatorial qa (machine verdict, unedited)
SCORE 3/5 after 2 attempt(s)
READS: The stark juxtaposition between clinical epidemiological data on the clipboard artifact and the visual Kaplan-Meier survival curve drawn over the fjord immediately establishes the actuarial metaphor.
FAILS: The glowing step-function sits as a detached HUD graphic over the water rather than structurally dictating the physical failure planes or calving fractures of the glacier wall.
READS: The stark juxtaposition between clinical epidemiological data on the clipboard artifact and the visual Kaplan-Meier survival curve drawn over the fjord immediately establishes the actuarial metaphor.
FAILS: The glowing step-function sits as a detached HUD graphic over the water rather than structurally dictating the physical failure planes or calving fractures of the glacier wall.
spec: antigravity agent · keyframe/artifact: gemini-3.1-flash-image · video: veo-3.1 image-to-video · qa+wall text: gemini-3.7-flash watching the render · 43.3s total